When your AS/400 was first set up, the reporting it produced was exactly what the business needed. Data came out as printed reports; spool files were distributed to the right people, and decisions got made. It worked.
But the business has changed. The people making decisions now expect to open a dashboard on their laptop, drill into a number, filter by region, and share a chart in a Teams message before the meeting ends. What they are getting instead is a flat file emailed from IT on Friday morning, formatted in a way that only one person fully understands, containing data from the previous day.
And here is the part that makes this more urgent than it might appear. The next generation of people coming into these roles have never worked with anything other than clean, visual, interactive interfaces.
The institutional knowledge that kept your AS/400 environment running is retiring. The people replacing it are showing up with completely different expectations.
So going forward, the ease of working with AS/400 is not about the system. It is about how easily you can connect its data to the tools your teams already use.
Have You Felt Any of these Visualization Gaps? Here's What Your Peers Are Saying
As one IBM i veteran put it,
"Whisper it quietly, but AS400 reports are a bit uninspiring. Lacklustre."
The number also supports it
According to the 2025 IBM i Marketplace Survey, 47% of organizations reported a lack of actionable insights from IBM i data. Many businesses rely on outdated reporting tools that cannot deliver real-time dashboards or advanced analytics.
Independent research shows that reports using simple charts and colors can hugely improve management decision-making, and over half of the IBM i community now consider reporting limitations one of their top five concerns.
1. The data exists, getting to it is the herculean Task
You have got years of transaction history, inventory movements, production records, and order data sitting inside Db2, accurate and intact, going all the way back to when the business first started running on AS/400.
And yet, your executives are still arguing over spreadsheets in Monday morning meetings.
While looking into how teams are actually dealing with this, one thread on Tek-Tips stopped me. A user evaluating reporting options for their iSeries wrote:
"The AS/400 Query tool is totally green screen based and not very user friendly. The output is very basic. We need something that can produce presentation quality reports and graphs."
That thread is years old. It is still being referenced today because the native reporting experience has not meaningfully changed.
Fewer than 5% of companies are properly managing their AS400 spool files. For everyone else, the process is the same. Spool file generates; someone in IT pulls it, converts it, formats it, and sends it out. If that person is on leave, the report does not go out. If they made an error in the conversion, nobody knows until the numbers do not add up in the meeting.
Read more about how AS400 automation can turn your spool files into live dashboards.
2. The interface was designed for data entry, not for thinking.
Talk to anyone who has spent time trying to pull meaningful analysis out of a green-screen environment, and the story tends to follow a familiar arc. They had a question, something straightforward like which product lines were underperforming last quarter or where inventory was piling up, and getting to the answer meant navigating through multiple screens, remembering the exact command syntax, knowing which physical file held the right data, and hoping that whoever set up the original report structure had documented what the field names actually meant. ORDQTY is quantity ordered. CSTMNO is customer number. None of that is written anywhere obvious. I, and when they leave, and they will, the entire reporting chain goes with them. The person who knows what ORDQTY means is typically 18 months from retirement. When that happens, there is no documentation, no handover, and no way for the next person to know what they do not know. lives in the head of the person who has been doing this for fifteen years.
So over time, teams stop trying to get answers directly from the system and start building workarounds around it. The most common one is the nightly export. Someone writes a job that pulls data from AS/400 every night, drops it into a shared folder or a SQL Server database, and then the analyst picks it up in the morning and works with it in Excel or a BI tool. It feels like a solution. And it is, right up until the job fails silently at 2am because a file structure changed, and the analyst sitting down at 9am has no idea they are looking at data that stopped updating three days ago. No alert fired. No error surfaced. The AS/400 did exactly what it was supposed to do. The fragility was in the manual chain wrapped around it.
What makes this particularly frustrating is that the data to answer every one of those questions has always been inside the system. The platform is not holding anything back. The interface just was not built for the kind of exploratory, iterative, visual work that modern analysis actually looks like, and so the gap between the data and the decision keeps getting filled by workarounds that are one broken job away from failing.
3. By the time the report arrives, it is already out of date
Think about what actually happens between the moment data is generated inside AS/400 and the moment a decision-maker sees it. A spool file runs. Someone in IT picks it up, converts it into something readable, formats it, and sends it out. That chain takes time, sometimes hours, sometimes until the next morning. And by then, the data in that report no longer reflects what is actually happening.
A study found that 80% of organizations are still relying on stale data for decision-making, and 85% of data leaders admit that decisions made on outdated data have directly cost their companies money. IBM For AS/400 environments where reporting is still driven by spool files and nightly batches, this is not a risk. It is the daily reality.
A production manager looking at the morning report sees inventory at a certain level. What the report does not show is that three purchase orders were received overnight, a line changed status at 6am, and a shipment was rescheduled. The report said one thing. The floor is doing another. And the manager is making decisions based on a photograph of a situation that no longer exists.
4. The numbers in the meeting room never agree.
This one will feel very familiar if you have sat in an operations or finance meeting in an AS/400 environment. Two people open their versions of the same report. The numbers are different. Not wildly different, just different enough that ten minutes get spent trying to figure out whose version is correct, instead of actually deciding anything.
This is a pattern that shows up consistently across AS/400 environments: teams spread across silos with multiple versions of truth for the same entry, overwhelmed with requests and without the bandwidth to reconcile them.
It happens because when data leaves AS/400 through a manual export, different people pull it at different times. One spreadsheet reflects Monday's closing inventory. Another reflects Tuesday morning's opening position. Both are technically accurate. Neither is useful when you are trying to make a decision together in the same room. The meeting becomes an argument about which number to trust rather than a conversation about what to do with it.
5. New team members cannot get the data at all.
A manufacturing client using AS/400 for inventory and order processing was dealing with high error rates and user frustration. These screens were being accessed 500 or more times a day by 30 users, resulting in hundreds of repetitive keystrokes and errors.
That error rate is worth paying attention to, because it was not caused by careless users. It was caused by an interface that offers no guidance. No prompts, no field labels that mean anything to a new user, no visual hierarchy that tells you what to do next. Everything depends on knowing the right sequence of commands, which means everything depends on one or two people who have been doing it for fifteen or twenty years.
When one of those people is on leave, requests pile up. When they retire, that knowledge does not transfer automatically. It walks out the door with them. And the new analyst who joins and asks how to pull last quarter's regional sales by product line gets either a 45-minute walkthrough from someone who has other things to do, or a support ticket that joins a queue.
3 Ways to Get Modern Analytics from Your AS/400 Without Replacing It
The best part is that none of this requires replacing AS/400. The data is already there. What is missing is a modern layer on top of it. There are three approaches that you can adopt to achieve this.
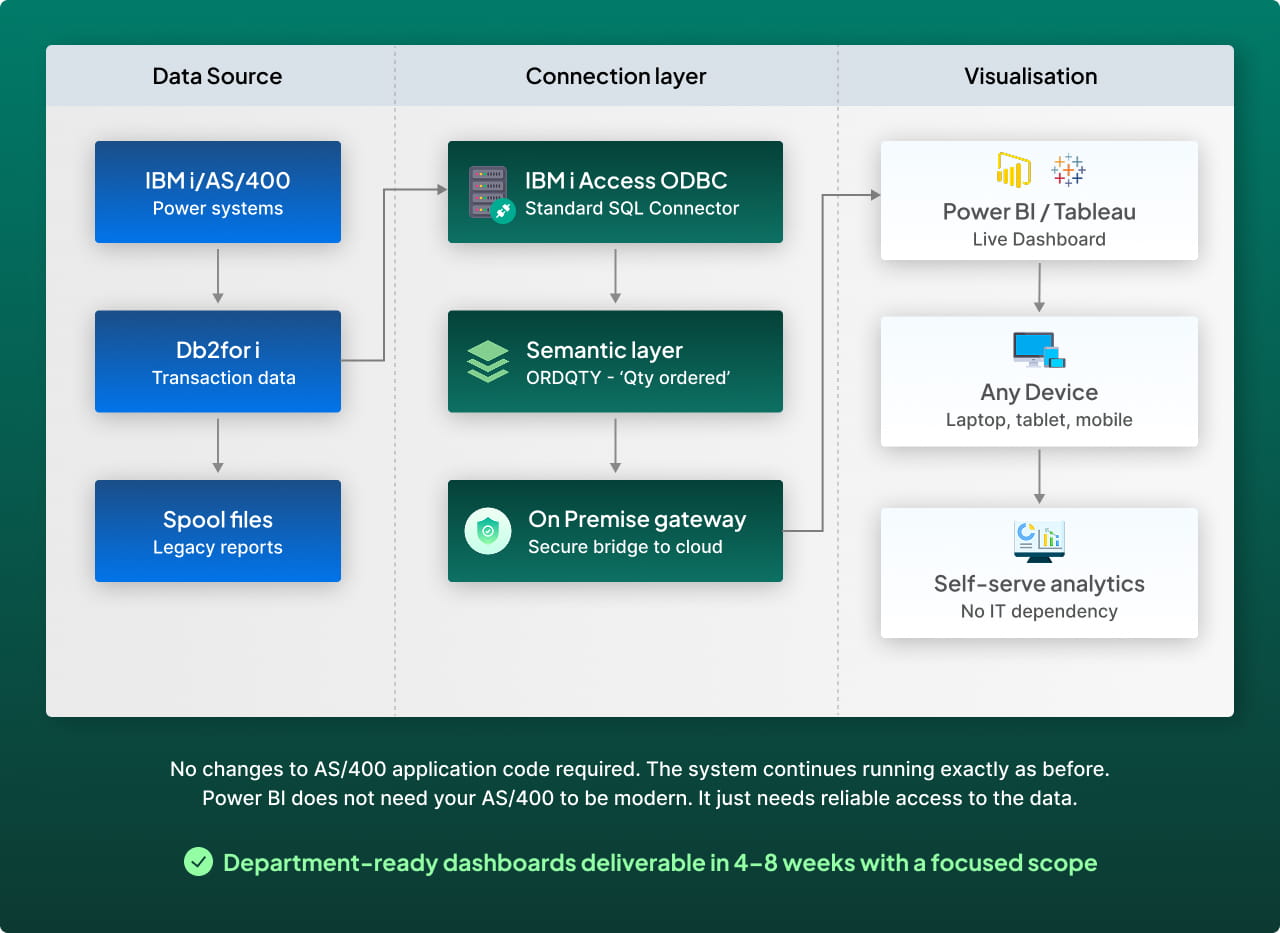
Approach 1: Connect AS/400 directly to Power BI or Tableau via ODBC
This is the fastest way to get modern visualization on top of AS/400 data. A distribution company we worked with was running a 4-hour Friday report cycle. Every week, someone in IT pulled the data manually, formatted it, and sent it out. After connecting Db2 directly to Power BI via ODBC, the same report now refreshes every 15 minutes with zero IT involvement. That is what this approach actually looks like when it works.
The connection works through the IBM i Access ODBC driver, which lets Power BI or Tableau query your Db2 data directly using SQL without anything needing to change on the AS/400 side. The data stays exactly where it is. The dashboard just starts reading it. One thing worth knowing before you set this up: use the IBM i Access ODBC driver specifically rather than the native IBM Db2 connector in Power BI Desktop, which does not support IBM i systems and will give you a connection error that is not immediately obvious to diagnose.
In many organizations it is realistic to get department-ready dashboards up within a few weeks to a couple of months when you start with a focused scope. However, large datasets and complex queries may benefit from the help of an IBM i specialist to configure the driver and optimize query performance. Power BI does not need your AS/400 to be modern. It just needs reliable access to the data.
This approach works best when the questions your team needs to answer sit entirely within AS/400. Which products sold the most last quarter. What the current inventory level is by warehouse. Where production throughput stands right now. If the answer lives in one system, this is the fastest and most straightforward path to getting it into a dashboard.
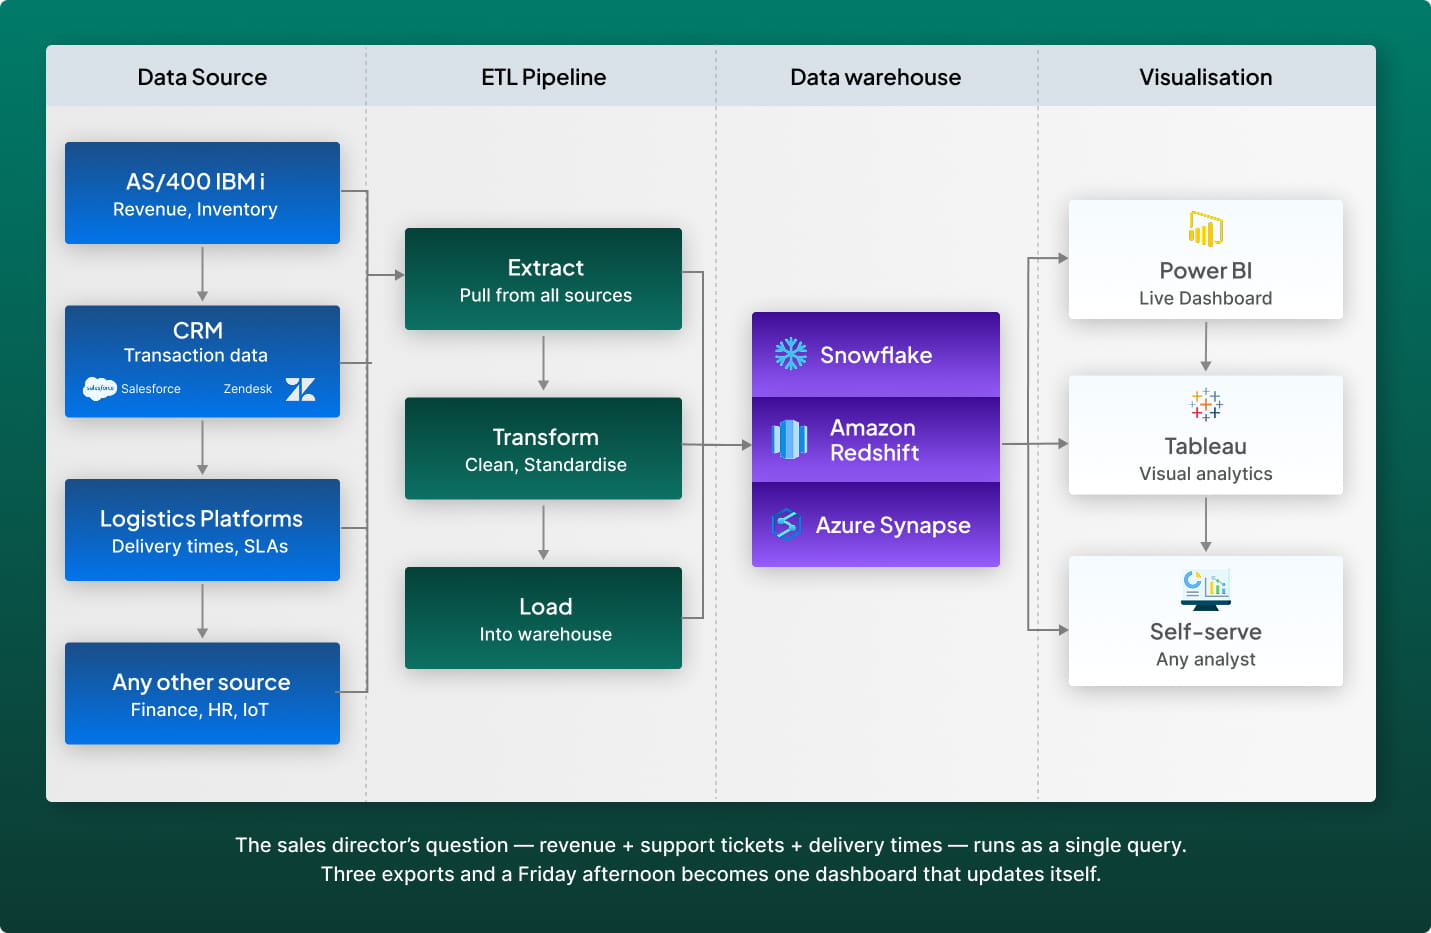
Approach 2: ETL pipeline to a data warehouse
With ODBC, you are connecting Power BI directly to AS/400 and that works well when the question you are trying to answer sits entirely inside AS/400. Which products sold the most last quarter. What the current inventory level is by warehouse. AS/400 has all of that and Power BI pulls it cleanly.
But now imagine a sales director asking a different question: which of our top customers by revenue are also the ones with the most open support tickets and the slowest delivery times? That answer sits across three different systems. Revenue is in AS/400. Support tickets are in Salesforce or Zendesk. Delivery times are in your logistics platform. ODBC gives you a window into one of those systems at a time. It does not give you a single place where all three can be combined, cleaned, and queried together without someone manually joining spreadsheets in between.
That is the gap a data warehouse solves. Think of it as a single room where data from every system shows up already cleaned and ready to be queried together. An ETL pipeline extracts data from AS/400, your CRM, your logistics platform, and any other source, transforms it into a consistent format, and loads it into a central warehouse like Snowflake, Amazon Redshift, or Azure Synapse. Power BI or Tableau then connects to the warehouse rather than directly to AS/400, which means faster queries, historical trend analysis across systems, and dashboards that bring together data that was previously impossible to reconcile in one view.
A manufacturer we worked with had their sales data in AS/400, customer service history in Dynamics 365, and delivery performance in a third-party logistics system. Getting a single view of customer profitability used to take three exports and a Friday afternoon. After building the warehouse, that same view runs as a single query and updates on a schedule without anyone touching it.
This approach is the right fit when your analysis regularly needs to pull data from more than one system, when leadership needs dashboards that combine financial, operational, and customer data in one place, or when your data volumes are large enough that querying AS/400 directly through ODBC starts to slow things down. If your questions can still be answered from AS/400 alone, the first approach is simpler and faster to set up. If you need data flowing in real time from AS/400 directly into other applications rather than into a reporting layer, the next approach is the better conversation.
Read more about AS400 ETL optimization and what peak performance looks like in practice.
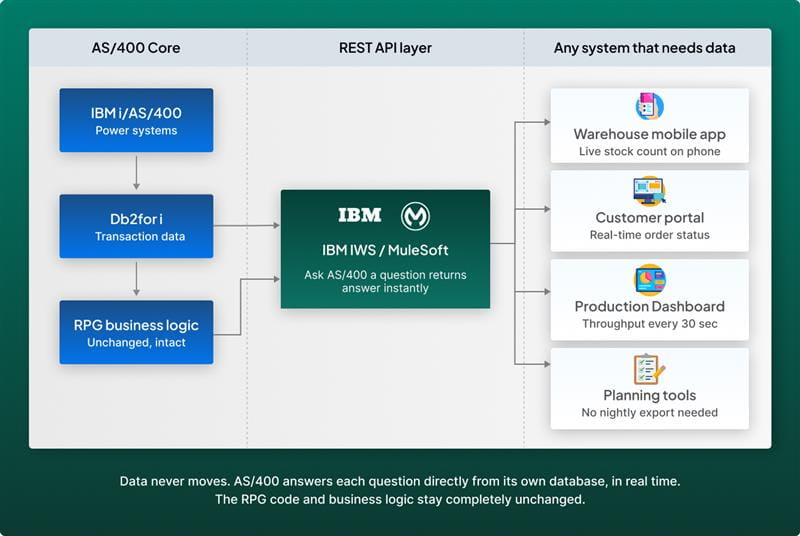
Approach 3: REST APIs exposing AS/400 data to any application
The first two approaches pull data out of AS/400 and take it somewhere else. This one works differently. You are not moving data anywhere. You are creating a way for other systems to ask AS/400 a question and get an answer back, right in that moment.
The simplest way to think about it is this. A warehouse operative on the floor needs to know the current stock level of a specific part. With ODBC or an ETL pipeline, that answer is sitting in a dashboard somewhere, refreshed every few hours or every night. With a REST API, their phone can ask AS/400 directly, get the answer in seconds, and show it on screen. The data never moved. Nothing was copied. AS/400 just answered a question.
That is what a REST API does. It creates a service window on top of your AS/400 data so that any system, any application, and any device can ask a specific question and get a specific answer in real time. Your customer portal can show buyers the live status of their order. Your production floor screen can pull throughput data every thirty seconds. Your planning team can build a forecast that talks directly to AS/400 instead of waiting for a nightly export to land.
The part that matters most is what does not change. The RPG code stays exactly as it is. The business logic stays exactly where it has always been. The only thing that changes is that other systems can now reach your AS/400 data without anyone having to manually extract anything.
This approach is the right fit when other applications, portals, or mobile tools need to access AS/400 data in real time rather than from a scheduled report or a warehouse refresh. It is also the right starting point for organizations that want to expose specific AS/400 business logic to external systems without rebuilding anything. If your primary need is analytics and reporting rather than live application integration, Approach 1 or 2 will get you there faster and with less complexity.
Before and After: What the Change Actually Looks Like
These are real patterns documented across IBM i modernization projects.
| Situation before | Situation after |
|---|---|
| IT staff spend 3-4 hours every Friday pulling, formatting, and emailing reports | Reports generate and distribute automatically on a schedule or trigger |
| Executives review yesterday's data in Monday morning meetings | Live dashboards show current-state data on any device |
| New analysts need 6-8 weeks before they can extract data independently | Any user with dashboard access can self-serve in days |
| Cross-system analysis requires manual exports from three different platforms | A data warehouse combines AS/400, CRM, and logistics data in one query |
| A single IT person holds all the knowledge of which tables contain what | Semantic layer translates Db2 field names into readable labels anyone can understand |
| Production floor decisions are based on batch reports from the previous shift | Real-time dashboards reflect current line status, throughput, and exceptions |
So What Should You Actually Do Next?
If you read this guide and recognized your environment in any of those six problems, the answer is not to pick an approach and figure it out alone. The right starting point depends on what your data looks like today, which systems you need to connect, and what your team actually needs to see. In a 30-minute session, our AS/400 specialists will map your data sources, identify which of the three approaches fits your environment, and give you a realistic timeline to your first live dashboard. No commitment, no proposal, just a straight answer based on what you are actually working with.