
Note for the Reader
A production-debugging guide for engineering teams running AI in production. When accuracy drops across a pipeline of vision, language, and classical models, here is how you find the hop that broke.
A product feature that read uploaded documents and answered questions had been returning wrong answers for nine days before a customer complaint exposed the problem. Nothing had crashed, and no exception had fired. The system simply kept producing fluent, confident answers, many of which were wrong.
Diagnosing the failure was difficult because the feature relied on four connected components: a computer-vision model, a language model, a ranking model, and supporting tool calls. The real question was not whether the language model had hallucinated, but which step had failed and why.
That is the real shape of LLM observability in production, and almost nothing written about it addresses this case. Search the term and you find definitions of observability and lists of tools. What you rarely find is the part that matters most when you are on call: how to trace a fault across a multi-model pipeline and localize it to a single hop. This guide is about that.
91%
of machine-learning models degrade over time, and the decline is usually silent. No error, no exception, just predictions that get steadily less accurate while the system keeps running.
Source: Bayram, Ahmed & Kassler, Knowledge-Based Systems (2022), cited across 2025–26 MLOps research.
What LLM observability means, and why one model is the easy version
LLM observability is the practice of capturing traces, metrics, and quality signals from a language-model application, so you can understand how it behaves in production and debug it when output degrades. It borrows three classic signals from traditional software: logs, metrics, and traces. Then it adds one that software never needed: an evaluation of whether the answer was correct, not just whether the service responded.
That last signal is what sets AI observability apart. A web service either returns a result or throws an error, so monitoring the error is usually enough. A model returns a result every time, confidently, whether the result is right or wrong. So, observability for AI has to watch the quality of the output, not only the health of the service producing it.
For a single model, this stays manageable. You log the prompt and the response, score the response for correctness, track latency and token cost, and watch for drift. Most tutorials stop here, and a demo that is fine. The difficulty begins the moment your feature stops being one model and becomes several.
Why a multi-model AI and CV pipeline is hard to debug
Real AI features rarely run on a single model. A document-understanding feature usually chains a vision or OCR model that extracts text, a language model that reasons over it, often a retrieval step that pulls in context, a classical model that scores or ranks, and tool calls that reach external systems. Each hop feeds the next, and that chaining is what makes the system hard to debug.
The core problem is that a fault at one hop does not announce itself there. It travels downstream and surfaces somewhere else. When the vision model misreads a single field, it hands clean looking but wrong text to the language model. The language model then does its job perfectly, reasoning faithfully over the input it was given and returning a confident answer built on a bad premise. Nothing in the language model's own metrics looks off, because the prompt was valid; the response was fluent, and the latency was normal. The error started two hops upstream and surfaced as a wrong final answer, with no fingerprint pointing back to its source.
The trigger is often something you do not control. In one real case, a computer-vision pipeline in the field collapsed after a camera firmware update changed the image preprocessing parameters. The model had never seen images with the new characteristics, so its accuracy quietly fell. No code changed on the engineering team's side; an upstream vendor pushed an update, and the model started failing. Without per-hop visibility, the team could not see that the input distribution had shifted, let alone connect it to the drop in final-answer quality.
67%
of organizations running AI at scale reported at least one critical issue caused by a model problem that went unnoticed for over a month. Three in four saw AI performance decline over time without proper monitoring in place.
Sources: 2024 enterprise AI survey (via MoldStud, 2025); Galileo AI, 2024.
What to instrument at each hop of the pipeline
The fix is to make every hop report on itself, then tie those reports together so you can read one request as a single connected story. Two things have to be true. Each hop logs its own inputs, outputs, and a quality signal specific to what it does. And a single trace ID follows the request through every hop, so you can pull up one failing request and see the whole path it took.
What you capture changes from one hop to the next. The table below maps each stage to what you log there and what that logging catches.
| Pipeline hop | What to log | What it catches |
|---|---|---|
| Input / ingestion | Schema, null rates, source, payload size | Upstream data or format changes |
| CV / OCR model | Confidence scores, field-level accuracy, image stats | Misreads, input-distribution shifts |
| Retrieval (if RAG) | Query, retrieved chunks, relevance scores | Bad or stale context feeding the model |
| Language model | Prompt, response, tokens, evaluation score, latency | Hallucination, prompt regressions, cost spikes |
| Tool / API calls | Inputs, outputs, status codes, latency | Broken integrations, timeouts |
| End to end | Trace ID across all hops, final-output quality | Where in the chain quality dropped |
This is also where LLM monitoring and LLM tracing do different jobs, and you need both. Monitoring watches the numbers you already know to watch, such as latency, error rate, and token cost, and it tells you when something is wrong. Tracing lets you reconstruct a request you never expected to fail, by following its trace ID across every hop, and it tells you where the failure happened.
The five pillars of LLM observability, applied to a multi-model system
Most write-ups frame LLM observability around five pillars. The framing is useful, but it usually assumes a single model. Here are those five pillars as they apply when several models share one pipeline.
- Tracing. A single trace ID follows one request through every hop, so you read the whole path instead of isolated logs scattered across services.
- Metrics. Latency, throughput, error rates, token usage, and cost, recorded per hop rather than for the system as a whole, so a slow or expensive stage stands out.
- Quality and evaluation. Automated scoring of whether the output was correct, faithful, and relevant, because uptime tells you nothing about whether the answer was right.
- Prompt and retrieval logging. The exact prompt, retrieved context, and response for every request, so you can reconstruct any failure after the fact.
- Drift and alerting. Watching input distributions and quality signals against a baseline, and alerting when they move, rather than waiting for something to crash.
The fifth pillar is the one that would have caught the camera-firmware case. If you track the distribution of what the vision model sees and alert when it shifts, you learn that the input has changed before your customers tell you the output has.
How to trace an accuracy drop across a CV-plus-LLM pipeline
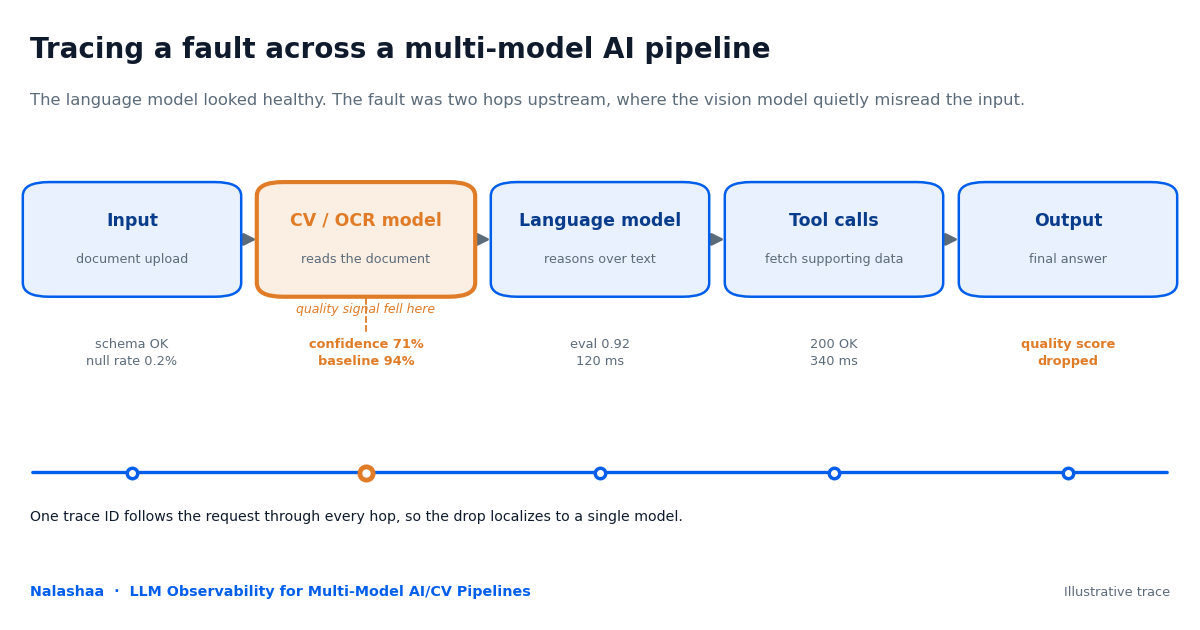
Return to the nine-day incident from the opening, and watch how per-hop instrumentation turns it from a mystery into a short sequence of checks.
The first move is to confirm the drop is real. The end-to-end quality score, the automated evaluation of final answers, fell below its baseline on a specific day. That gives you a date and a magnitude to work with, instead of a vague complaint. Next you pull the traces for the failing requests. Because every request carries a trace ID across all hops, you can isolate the ones that scored badly and inspect the full path each took.
Now you walk the hops and compare each one's quality signal against its baseline. The language model's metrics look normal, with valid prompts, fluent responses, and normal latency, and the retrieval step looks normal too. The vision model is the outlier: its average confidence dropped on the same day the final score fell, and its field-level accuracy on one field collapsed. The signal diverged at that hop and nowhere else. The last step is to confirm the mechanism. The vision model's input statistics show the images changed character on that date, which traces back to an upstream preprocessing change. The language model was never the problem; it had been faithfully reasoning over text the vision model read wrong. You found the broken hop in four steps instead of nine days, because each hop reported on itself and one trace tied them together.
Confident and wrong is the dangerous failure
When a service crashes, you know within seconds, because it triggers an alert. A model that quietly degrades sets off nothing. It keeps returning fluent, confident, plausible output that happens to be wrong, and it can do that for weeks before anyone notices the business metric slipping. This is why observability for AI has to watch the quality of the output, not just whether the service is up. The worst incidents are the ones that never threw an error
How to attribute a latency spike to the right model
The same per-hop discipline answers the other question that comes up constantly in production: the feature got slow, and you need to know which model to blame.
A single end-to-end latency number cannot tell you that, but span timing can. When each hop records its own duration as a span under the request's trace, a latency spike resolves into a clear culprit. It might be the language model's inference time climbing, a tool call starting to time out, or the retrieval step slowing under load. Span timing also separates model inference time from network and tool time, which matters because the remedy for each is different. Tuning a model you cannot speed up wastes a week, and span-level timing is what points you at the hop that actually moved.
Choosing observability tooling without locking yourself in
The tooling market is crowded, and most of it is good. General application-performance platforms like Datadog and Dynatrace now cover AI workloads. LLM-native tools like Langfuse, Arize, and Honeycomb focus on traces, evaluations, and prompt logging. Any of them can do the job. The real risk is not picking the wrong tool, but wiring your instrumentation so deeply into one vendor's SDK that you cannot leave.
The durable approach is to capture traces and metrics on an open standard first, then send that data to whichever backend you choose. OpenTelemetry has become the common standard for this, and it now includes conventions for AI and agent workloads. Instrument once against the standard, and your observability data stays portable. When a tool stops fitting your needs or your budget, you swap the backend, not your codebase.
This is also where the decision turns commercial. Agent observability and AI observability are where teams spend real budget, because production reliability is what protects revenue. Spending that budget on portable instrumentation rather than a locked-in stack is the difference between a tool you can grow out of gracefully and one you are stuck with.
Instrument once, stay portable
The fastest way to regret a tooling choice is to bind your instrumentation directly to one vendor's SDK. Capture traces and metrics on an open standard like OpenTelemetry, then route that data to the backend you prefer. When the tool no longer fits, you change the destination, not the plumbing.
How Nalashaa builds observability into multi-model AI systems
Most teams discover the need for this the hard way, in the middle of an incident like the one that opened this guide. Building observability in from the start is far cheaper than retrofitting it under pressure. Doing it well takes engineering judgment about what to instrument, what to score, and what to alert on across models that each fail in their own way.
Nalashaa's AI engineering team instruments multi-model pipelines end to end, covering vision, language, retrieval, and tool calls on open standards. That lets you trace any accuracy drop or latency spike to the exact hop that caused it. We build the evaluation and the drift alerting that catch silent degradation before your users do, and we do it without locking you into a single vendor's stack.
Running AI in production and flying blind?
Nalashaa instruments multi-model pipelines end to end on open standards, so you can trace any accuracy drop or latency spike back to the hop that caused it.
Observability is one half of running AI reliably in production. The other half is stopping bad output before it ships, which we cover in our guide to building reliable AI agents with guardrails. Both halves assume you have already settled where to run your models, the subject of our self-hosted versus cloud LLM cost model. Much of this instrumentation discipline carries over from distributed systems, which we wrote about in DevOps observability for microservices.
The bottom line on observability for multi-model AI
In a multi-model system, the goal is not watching one model. It is localizing a fault across a chain of them before it reaches a user. A single model is the tutorial case. A pipeline of vision, language, classical, and tool-calling models is the real system, and its failures tend to hide two hops away from where they surface.
Three habits make the difference between a nine-day silent incident and a four-step investigation. Instrument every hop, so each one reports its own inputs, outputs, and quality. Trace the whole request, so a single trace ID ties those hops together. And alert on quality and drift, not uptime alone, because the failures that hurt most are the ones that never throw an error.
Frequently Asked Questions
What is LLM observability?
LLM observability is the practice of capturing traces, metrics, and quality signals from a language-model application so you can see how it behaves in production and debug it when output degrades. It extends traditional observability by evaluating whether answers were actually correct, not just whether the service responded.
What are the five pillars of LLM observability?
Tracing, metrics, quality and evaluation, prompt and retrieval logging, and drift detection with alerting. Together they let you reconstruct any request and catch silent quality drops before they reach users.
How is LLM observability different from LLM monitoring?
Monitoring tracks known metrics like latency and error rate, while observability lets you investigate problems you did not predict by tracing a request through the system. Monitoring tells you something broke; observability helps you find where and why.
Why is a multi-model AI pipeline harder to debug than a single model?
A fault at one hop, such as a vision model misreading a field, produces clean-looking but wrong input for the next model, which processes it faithfully and returns a confident wrong answer. Without per-hop tracing, you cannot tell which model actually failed.
What tools are used for LLM observability?
General application-performance platforms like Datadog and Dynatrace and LLM-native tools like Langfuse, Arize, and Honeycomb all work. The durable choice is to instrument on an open standard like OpenTelemetry so your data stays portable across them.
How do you detect model drift in production?
Track input distributions and output-quality signals against a training-time baseline and alert when they diverge, using statistical tests like the Population Stability Index, rather than waiting for business metrics to drop.