Your product worked perfectly with fifty clients. At three hundred, load times are climbing. Support tickets are growing. Your team is spending more time on firefighting than shipping features. And the last two releases each introduced regressions that nobody anticipated.
If this sounds familiar, it is a pattern of Nalashaa's engineering teams to have diagnosed dozens of ISV and SaaS products at exactly this stage of growth. The symptoms vary. The root cause almost never does architecture that was designed for an earlier version of the business and has not kept pace with it.
The decisions that got your product here were the right ones at the time. They were made under real constraints: tight deadlines, limited resources, and an incomplete picture of how the product would need to grow. The challenge now is helping those decisions evolve alongside the business.
The research gives a clear picture of what is at stake if that evolution is delayed. A McKinsey survey of CIOs found that tech debt amounts to 20 to 40 percent of the value of their entire technology estate, with 10 to 20 percent of the technology budget dedicated to new products being diverted to resolving tech debt instead. Stripe's 2018 Developer Coefficient study found that developers spend around 33% of their working time dealing with tech debt, time that is better spent on features, performance, and stability.
This post gives you the diagnostic framework your team needs to move forward.
Five Signals Your Architecture Is the Constraint
Before diagnosing specific root causes, let's confirm that you are dealing with an architecture problem rather than a team or process issue. The five signals below point specifically to the codebase as the constraint.
Signal 1: Response times scale proportionally with user count
If API response times roughly double when active user count doubles, this typically points to a database bottleneck. The most common culprit is the N+1 query problem, where a request for one piece of data triggers a cascade of secondary database calls. This pattern is invisible at low data volumes and becomes unsustainable once the query count crosses a threshold. It is one of the most common performance anti-patterns in ORM-based systems.
Signal 2: Deployments affect parts of the system that were not touched
When a change to the invoicing module breaks the patient scheduling screen, this is a sign of module coupling. Modules that were designed to be independent are sharing state, accessing each other's database tables directly, or relying on undocumented side effects. Each deployment carries more uncertainty than it should.
Signal 3: A single feature change requires coordinating updates across multiple modules
If adding a field to a patient record means updating five separate places in the codebase (the model, the API, the background job, the notification system, and the export service), the architecture is too tightly coupled. The coordination cost of this kind of change slows every sprint and makes estimation harder.
Signal 4: Cloud costs grow faster than revenue
Inefficient resource provisioning, over-sized instances, and the absence of auto-scaling cause infrastructure costs to grow in a pattern disconnected from actual business growth. This signal often appears alongside Signal 1: teams respond to performance issues by scaling up hardware rather than addressing the underlying query problem.
Signal 5: The team reports increasing uncertainty about what will break
This is the velocity signal. When engineers describe finding it difficult to predict what will break when code ships, the underlying problem is usually the absence of automated testing, feature flags, and CI/CD practices that make change safe. Development velocity can drop 50 to 70% when architectural issues compound beyond a team's ability to reason about them, a figure cited in Dual Boot Partners' engineering research on what happens when these signals are left unaddressed for long enough.
The Six Root Causes of Product Scaling Failure
Most scaling problems trace back to one or more of the following architectural root causes. Each has a recognizable pattern, a specific symptom, and a clear path forward.
Root Cause 1: Database bottlenecks
The most common cause of performance degradation in growing SaaS products. Symptoms include query times growing as data volume grows, all reads and writes hitting a single database instance, no connection pooling, and application-level joins doing work the database should handle.
Fix: Introduce a caching layer (Redis is the standard choice for most stacks) to cache frequently read, infrequently updated data. Add read replicas to distribute read traffic. Audit all ORM queries with an explain plan. The N+1 query pattern alone often accounts for 60 to 70% of database load in products that have never had a systematic query review. Add connection pooling (PgBouncer for PostgreSQL is widely used) to prevent connection exhaustion under load.
Root Cause 2: Monolithic coupling
A monolith is not inherently a problem. A tightly coupled monolith, where every module knows about every other module's internals, is. In a tightly coupled monolith, one deployment unit means one failure domain and one scaling unit. You cannot scale the reporting module independently from the patient intake module, even if one is under dramatically more load than the other.
Fix: Before considering microservices, enforce modular boundaries inside the existing codebase. Modules should communicate through well-defined interfaces rather than by accessing each other's database tables directly. This architectural discipline, sometimes called a modular monolith, delivers most of the maintainability benefits of microservices without the operational overhead.
Root Cause 3: Synchronous everything
If every operation in your system is synchronous, a slow email service, a third-party API, or a background analytics job can freeze a user-facing workflow. This is a classic architectural coupling problem at the network layer rather than the code layer.
Fix: Introduce asynchronous messaging queues for non-critical paths. An appointment reminder email does not need to be sent synchronously during a patient registration flow. A usage analytics event does not need to be processed in real time before a user can save a record. Decoupling these operations with a message queue (AWS SQS, RabbitMQ, or similar) removes them from the user's critical path entirely.
Root Cause 4: Stateful application servers
If your application servers store session state in memory, meaning a user's session is only valid on the specific server that handled their last request, you cannot add more servers without breaking sessions. Every horizontal scaling attempt introduces a session routing problem.
Fix: Externalize session state to Redis or a managed session store. Make your application tier completely stateless so that any server can handle any request. This is the prerequisite for meaningful horizontal scaling and auto-scaling groups in any cloud environment.
Root Cause 5: Missing observability
Teams cannot fix what they cannot measure. If your team is spending significant time debugging production issues without distributed tracing, centralized logging, or application performance monitoring, every incident takes longer to resolve than it should. The 2023 DORA research found that high-performing DevOps teams deploy code 224 times more frequently and recover from failures 18 times faster than low-performing teams.
Fix: Instrument your application with OpenTelemetry. Deploy a centralized logging stack and add application performance monitoring. Set up alerting that notifies the right person within minutes of an anomaly, not after a customer reports an issue.
Tool Decision Heuristics
- Use ELK if your team prefers self-hosted control and already runs Elasticsearch — the ecosystem is mature and the query language is powerful, but plan for operational overhead.
- Use Grafana Loki if you are already in the Grafana ecosystem and want lightweight, cost-effective log aggregation without indexing every field.
- Use Datadog or New Relic if operational simplicity matters more than cost at your current scale — managed APM with minimal setup, strong out-of-the-box dashboards, and broad integration coverage.
- Use AWS CloudWatch if your infrastructure is already on AWS and you want native integration without adding a third-party vendor to your stack.
Root Cause 6: Technical debt accumulation
Technical debt, as Ward Cunningham defined it in 1992, is the future cost of code that is easy to implement now but harder to maintain later. In a high-growth product environment, it extends beyond messy code to architectural decisions, undocumented dependencies, and infrastructure choices made under deadline pressure that have never been revisited.
Forrester's 2025 Technology and Security Predictions report projects that 75% of technology decision-makers will see their technical debt rise to a moderate or severe level by 2026, driven by the rapid development of AI solutions that add complexity to IT landscapes faster than teams can govern it. The pattern is familiar: ship fast now, fix it later, until "later" keeps getting pushed and the velocity decline becomes self-reinforcing.
How to Fix Scaling Problems Without a Full Rewrite
The instinct to rewrite everything is understandable. In most cases, though, a full rewrite is counterproductive. It typically takes six to twelve months, introduces new bugs in systems that were previously stable, and can reproduce the same architectural challenges in a clean codebase if the underlying decisions are not examined carefully. A phased approach delivers measurable improvement at each stage without the risk of a ground-up rebuild.
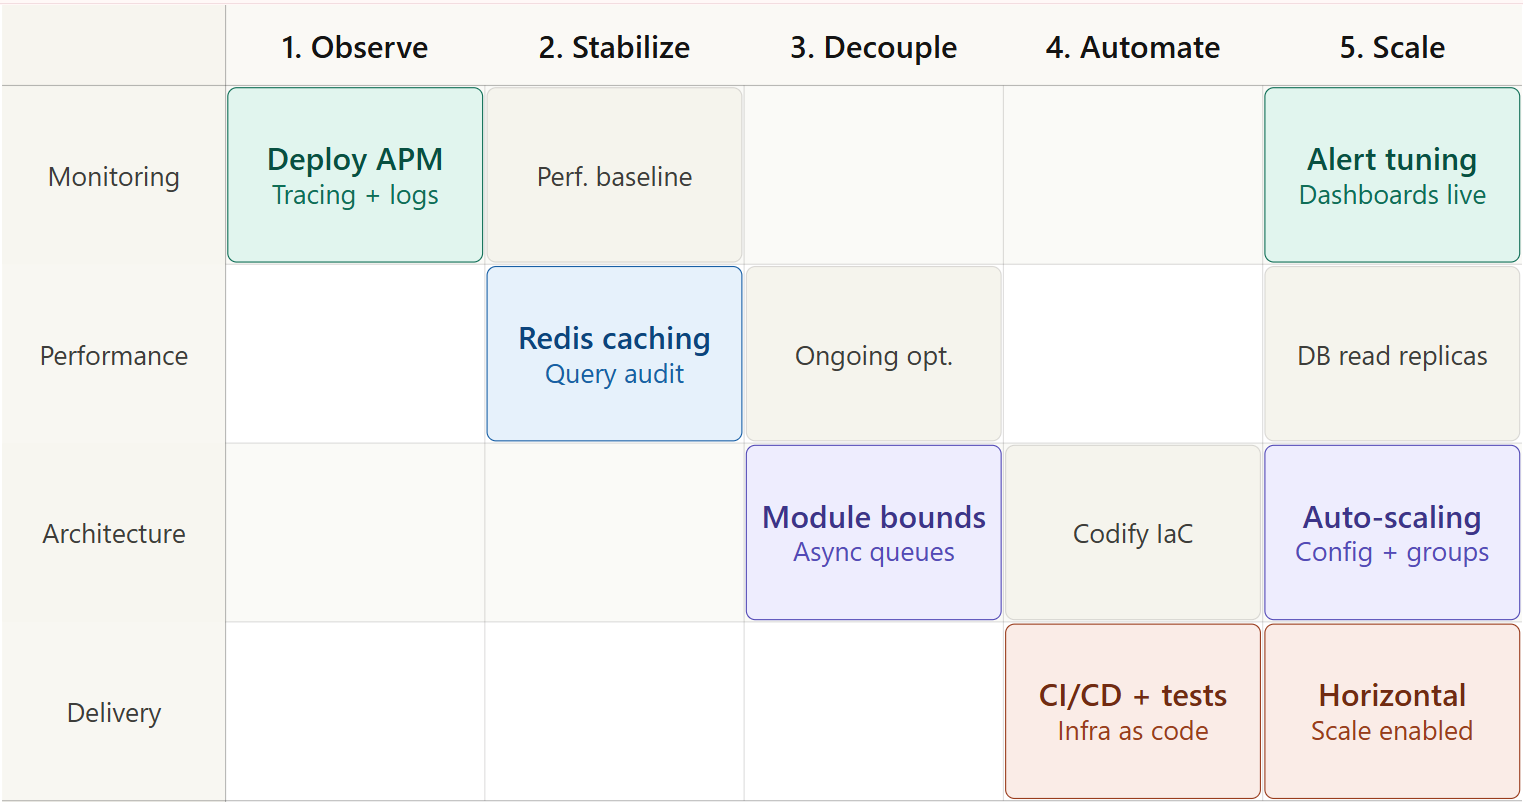
Phase 1: Observe
Implement monitoring and tracing before changing anything. A production trace run over two to four weeks will surface the highest-impact bottlenecks clearly. Skip this step and you risk optimizing the wrong things.
Phase 2: Stabilize
Fix the highest-impact quick wins: Redis caching for the most-queried data, query optimization for the top five slowest endpoints, and connection pooling if it is missing. Run load tests to establish a performance baseline. These changes are low-risk and typically deliver 30 to 50% performance improvements within a sprint.
Phase 3: Decouple
Enforce module boundaries inside the existing codebase. Identify the two or three modules with the highest independent load or change frequency and extract them as standalone services if the team is ready for that step. Introduce async queues for non-critical background operations.
Phase 4: Automate
Build CI/CD pipelines, automated testing suites, and infrastructure-as-code so that every change is safe and every environment is reproducible. The State of DevOps research shows this investment pays back in deployment frequency and incident recovery time more than any other single practice.
Phase 5: Scale
With a clean architecture, full observability, and automated delivery in place, horizontal scaling becomes straightforward. Auto-scaling groups, containerization, and service-level scaling are now achievable without the session state and coupling problems that made them difficult before.
When Your Team Needs a Second Set of Eyes
Internal teams sometimes reach a wall with scaling problems for predictable reasons: the bottleneck is in foundational architecture that is difficult to see clearly from inside the codebase; the team is fully occupied with feature delivery and has no bandwidth for a systematic architecture review; or there is a scaling deadline, a major enterprise deal, a funding round, a product launch that makes the current risk profile untenable.
From Nalashaa's Architecture Assessments
In Nalashaa's architecture assessments, Signal 1 and Root Cause 1 appear together in the majority of engagements, response times degrading under load, with the underlying cause tracing directly to unoptimized queries and missing caching. It is the most consistently underestimated problem at this growth stage, because it is invisible in development environments and only becomes critical in production. Teams that address this pairing first, before tackling coupling or infrastructure, see the fastest measurable return in the shortest time.
All three are legitimate reasons to bring in an external engineering partner, not to hand off the problem, but to get an honest diagnostic and a prioritized fix plan that the internal team can own and execute. A structured five-day architecture review that produces a clear bottleneck map and a phased remediation roadmap is one of the highest-ROI investments a team can make when a product is hitting a scaling ceiling
The Bottom Line
Scaling challenges are predictable. The six root causes in this post account for the majority of performance, reliability, and velocity issues that growing SaaS products encounter. None of them signal that the team built something wrong. They are the natural consequence of building fast under real-world constraints and addressing them systematically is how healthy products grow.
The goal is to get ahead of the 50 to 70% velocity decline that makes a product genuinely difficult to operate. Start with observability, fix the database, decouple the modules, and automate the delivery. Then scale.
Ready to Take the Next Step?
If three or more of the signals in this post sound familiar, an architecture review before your next scale milestone can give you a clear path forward. Nalashaa's product engineering services runs a structured Architecture Assessment: a five-day deep dive into your current system with a prioritized remediation roadmap.
Walk away with a bottleneck map and a prioritized remediation roadmap. Book a 5-day Architecture Assessment.
Frequently Asked Questions
Q: Why does software stop scaling?
Software stops scaling when architectural decisions made for a smaller system become constraints at larger scale. The most common causes are database bottlenecks from missing caching and indexing, tight module coupling that prevents independent scaling, stateful application servers that cannot be replicated, and the absence of observability that makes performance issues invisible until they become critical.
Q: How do I fix software scalability issues?
Start with observability — you cannot fix what you cannot measure. Then address quick wins: caching, query optimization, and connection pooling. Then tackle structural issues: module decoupling, async communication patterns, and stateless application design. Finally, automate delivery with CI/CD to make future changes safe and frequent.
Q: What is technical debt in SaaS?
Technical debt is any friction in a system that slows the engineering team down, including messy code, undocumented dependencies, missing automated tests, and architectural decisions that were correct for an earlier stage of the product. A McKinsey survey of CIOs found that tech debt amounts to 20 to 40 percent of the value of their entire technology estate, with new product budgets absorbing 10 to 20 percent of the cost to service it. Stripe's 2018 Developer Coefficient study shows developers spend around 33% of their time on tech debt.
Q: When should I consider microservices?
Microservices are worth considering when specific modules need to scale independently, when team size and maturity support the operational overhead, and when a modular monolith has already enforced clear internal boundaries. They are not the right first response to a scaling problem. The right first response is observability and query optimization.